-
- Getting Started
- Record Tabs
- Managing Duplicate Records
- Setting Up Grid Layouts
- Show and Hide Columns
- Key setup steps
- Additional setup steps
- Tips & Tricks
- Pinning Activities
- Bulk update
- Timeline
- Bulk uploading images
- Advanced Filters
- Automated Workflows
- System Admin in CRM
- Search, sort and report
- Calendar View
- Dashboard View
- Using Views
- Import troubleshooting
- List View
- Set up your customers in CRM
- Working with Activities in CRM
- Basic Navigation
- Using the Map View
- Using the Kanban View
- Configuring Dropdown Lists
- Creating New Records
- Open or Edit Existing Records
- View Details on Map Pins
- Syncing Your Accounting System
- Change the Column order
- Setting up your CSV file for Import
- Filter Map Records
- Company Information
- Sorting Records
- Export data
- Filtering Records
- Import Data from Excel or CSV
- Colourise Map Records
- Set Up Security Groups
- Invite Other Users
- Connect Outlook
- Connect to Mailchimp or Campaign Monitor
- Set Up Other Reference Data
- Configure Online Quoting
- View Reports and Dashboards
- Connect Burst SMS
- Viewing Tags
- Adding and Editing Tags
- Sorting and Filtering with Tags
- Jobs, Assets & Service Management
- Manufacturing
- Operations
- Reporting
- Training
- Workflow Management
- Quoting & Selling
View Reports and Dashboards
Reports and dashboard are tools that the majority of businesses will regularly utilise. They give you a visual, filterable, specific and shareable view of your data that many people rely on.
There are several ways you can access reporting in CRM.
See also:
- Working with Reports
- Scheduled Reports
- Exporting data to Excel
- How to search, sort and report in CRM
Dashboards
- These can be accessed using the view selector at the top of the screen (where available).

- You can also access them from Reporting > Dashboards which is a repository of every Dashboard in CRM.
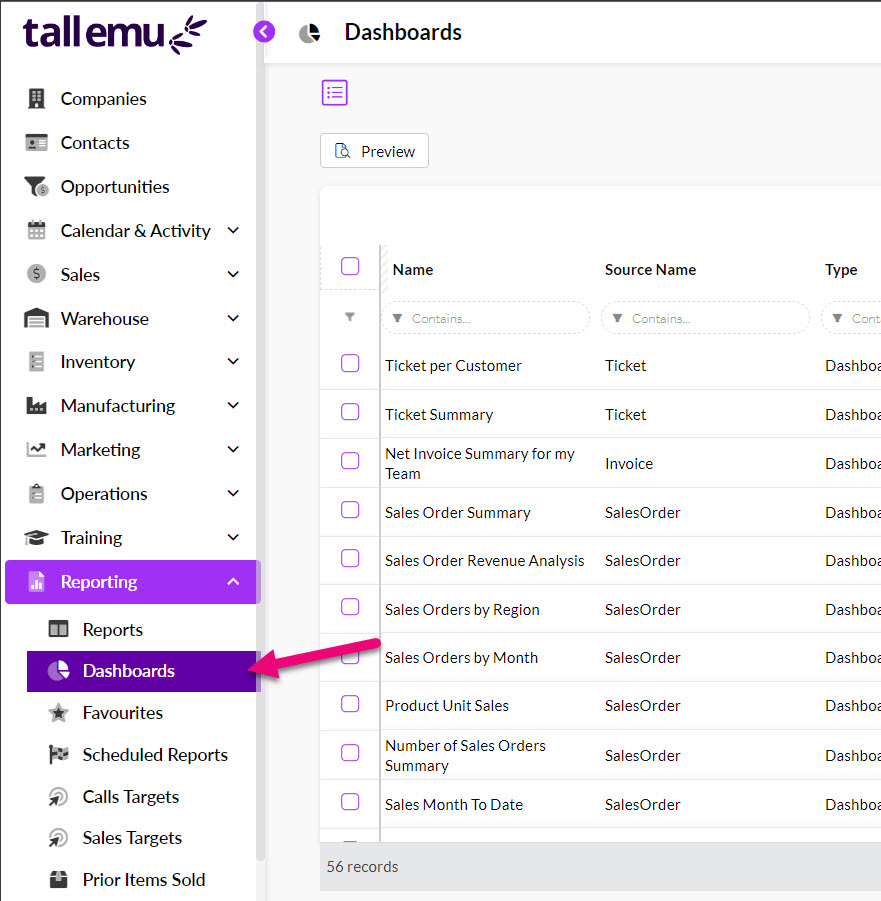
- Just click on any Dashboard to open it and reveal the option to save it to your Favourites or view it.

Reports
- You can access these from Reporting > Reports.

- To quickly open a report, select it on the list and click on Preview.
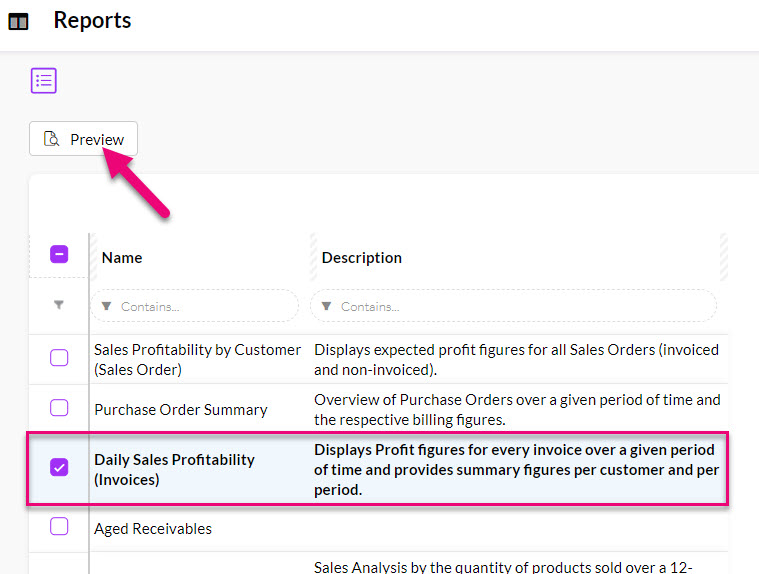
- You can also click on a report to reveal further options to add it to your Favourites list or set it to email out on a schedule. You can also view the report from this screen.
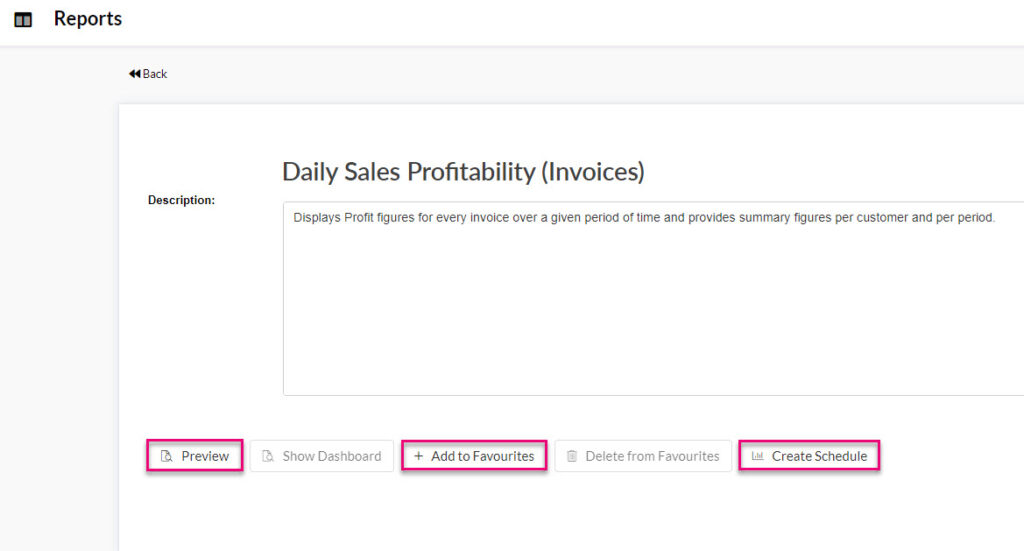
Scheduling Reports
In Reporting > Reports there are a range of reports you can run on an ad-hoc basis, but you can also schedule reports to be automatically emailed.
- Open any report and click on the Create Schedule button, then input the specifics.
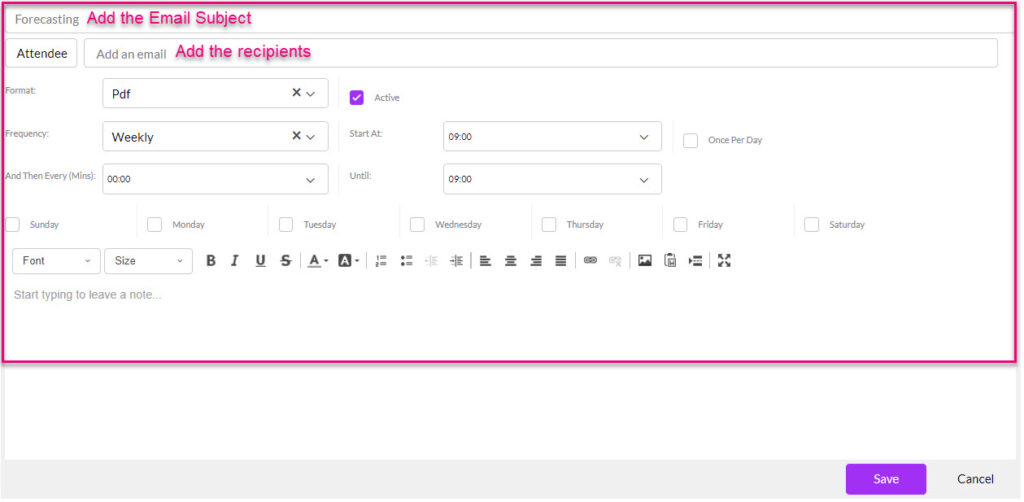
- You can specify the exact frequency that the email is sent – daily, weekly, monthly, even multiple times a day.
- This then sends an email to the recipients you specify with a copy of a report attached; in the format you have chosen (i.e. PDF, xls or CSV) with any optional email text you want to add.

To disable or adjust schedules, go to Reporting > Scheduled Reports you can see anything you have scheduled previously – just click on a record to open it and adjust the details, or de-select the Active box to disable the workflow.
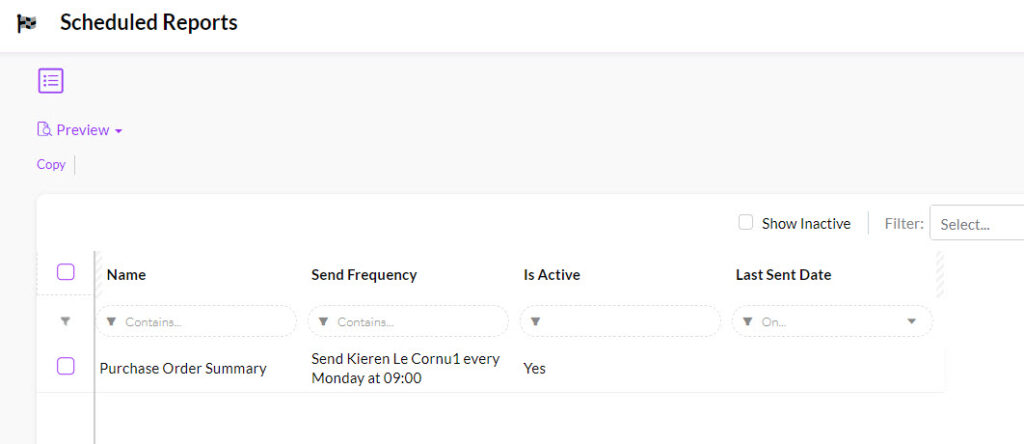

Pro Tip: if you have a lot of reports scheduled and can’t remember exactly what they are, select one in the Scheduled area and use the preview button to quickly view it.

Favourites
So that you don’t have to search every time you want to open a particular Report or Dashboard, you can mark frequently used ones as a Favourite.
Reporting > Favourites allows you to keep your own list of Reports and Dashboards for quick access.

Filtering your data
Your first line of reporting will always be List View; from here you can:
- Show and hide columns.
- Change the display order of columns.
- Sort records.
- Filter records or create Advanced Filters.
- Set up Layouts.
Export data to create your own reports
In a lot of areas or CRM you can export data to Excel and then use this to create your own reports. Click here for more information on exporting your data.
