-
- Getting Started
- Record Tabs
- Managing Duplicate Records
- Setting Up Grid Layouts
- Show and Hide Columns
- Key setup steps
- Additional setup steps
- Tips & Tricks
- Pinning Activities
- Bulk update
- Timeline
- Bulk uploading images
- Advanced Filters
- Automated Workflows
- System Admin in CRM
- Search, sort and report
- Calendar View
- Dashboard View
- Using Views
- Import troubleshooting
- List View
- Set up your customers in CRM
- Working with Activities in CRM
- Basic Navigation
- Using the Map View
- Using the Kanban View
- Configuring Dropdown Lists
- Creating New Records
- Open or Edit Existing Records
- View Details on Map Pins
- Syncing Your Accounting System
- Change the Column order
- Setting up your CSV file for Import
- Filter Map Records
- Company Information
- Sorting Records
- Export data
- Filtering Records
- Import Data from Excel or CSV
- Colourise Map Records
- Set Up Security Groups
- Invite Other Users
- Connect Outlook
- Connect to Mailchimp or Campaign Monitor
- Set Up Other Reference Data
- Configure Online Quoting
- View Reports and Dashboards
- Connect Burst SMS
- Viewing Tags
- Adding and Editing Tags
- Sorting and Filtering with Tags
- Jobs, Assets & Service Management
- Manufacturing
- Operations
- Reporting
- Training
- Workflow Management
- Quoting & Selling
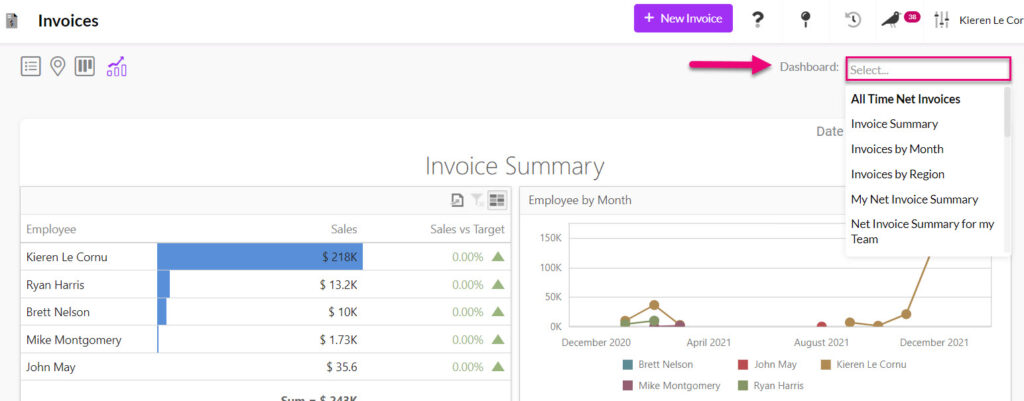
Dashboard View
In several areas of CRM, you can quickly access reporting using Dashboard View, which will give you access to a range interactive graphs and charts that let you drill down into your data.
Just click on the chart icon in the view selectors at the top of the screen.
Note that Dashboard View is not available in all areas of CRM.


Once you have opened the view, you can adjust it in several ways.
Select from different Dashboards
In the top right-hand corner, you can select from a range of different dashboards using the dropdown menu.
Change the date range for the data
Click on the date options to adjust the view to show a different period.

A box will open and allow you to select a different period, just click Apply when you’re done.

Filter the data
Dashboards are interactive, meaning that you can click on various elements to drill down into the data.
For example, if I wanted to know more about the sales for a specific User, I can click on the User’s name and the other panels of the dashboard will adjust to show only data related to that User.
Starting with this dashboard:
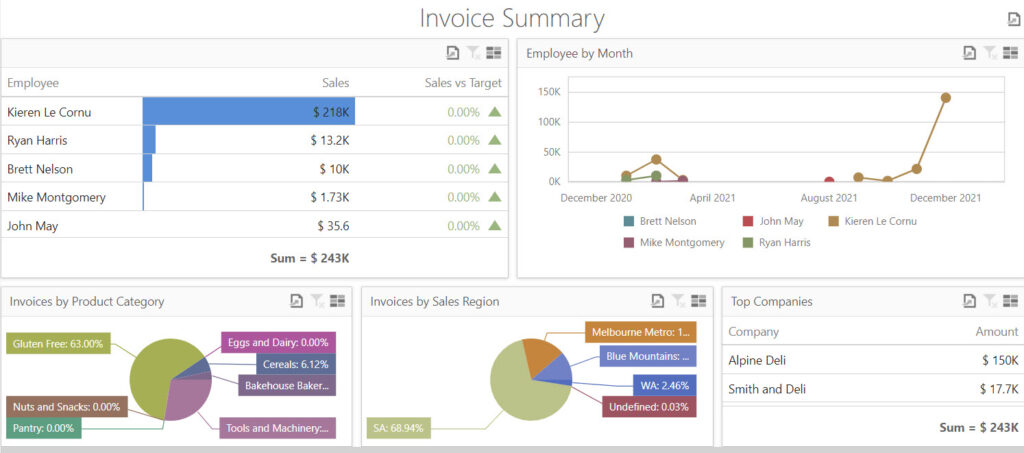
If I click on the Employee line for Ryan Harris, the rest of the panels are filtered to show only his information.

If I want to clear the selection and return the dashboard to its original state, I click on the funnel icon to clear the filter I’d applied.
![]()
If I wanted to select more than one Employee to filter the data by, I click the multi-select button which allows me to select more than one person.

Export data
Click on the export icons to reveal the data export options and then select one.
Note that depending on the type of dashboard you have open, the number and position of the export buttons will vary.
